
What is ADAPt?
ADAPt is FAO Papua New Guinea’s public early-warning dashboard for El Niño-related agricultural drought risk. It is built around the Combined Drought Index (CDI), developed jointly by PNG’s National Weather Service (NWS) and FAO, and brings together live vegetation-health screening, composite biophysical stress, and population exposure analysis in one place to support early warning, provincial prioritisation, and field verification planning.
Use this tab to understand the CDI methodology behind ADAPt. The Overview, Interactive Map and Provincial Data tabs present the live screening outputs that ADAPt generates from it.
About the Combined Drought Index (CDI)
The Combined Drought Index (CDI) is being developed jointly by Papua New Guinea's National Weather Service (NWS) and FAO to assess drought severity and trigger anticipatory action, complementing NWS's existing Drought Early Warning System. It is based on published research (Isaev E, Yuave N, Inape K, Jones C, Dawa L & Sidle RC, 2024, Agricultural Drought-Triggering for Anticipatory Action in Papua New Guinea, Water 16, 2009) and computed at province level, monthly, from free/open, programmatically-accessible data sources with a historical archive back to 1996.
| Indicator | Source | Flag rule | Weight |
|---|---|---|---|
| ENSO (Relative Niño3.4) | NOAA | 0.5 if alert, 1 if declared | 20% |
| Indian Ocean Dipole (DMI) | NOAA | 0.5 if alert, 1 if declared | 10% |
| Present rainfall (SPI-1) | CHIRPS, Climate Hazards Center (UCSB) | 0.5 if -0.5≤SPI<0, 1 if SPI<-0.5 | 20% |
| Present soil moisture | ERA5-Land, ECMWF | 0.5 if 5-15% below normal, 1 if >15% | 20% |
| Present vegetation health | FAO ASIS | 0.5 if VHI<0.4, 1 if VHI<0.3 | 10% |
| Forecast rainfall (SPI-3) | ECMWF SEAS5 | 0.5 if -1≤SPI<0, 1 if SPI<-1 | 20% |
Combination: these six flags are combined into a weighted sum ranging from 0 to 1. Operational phase (FSC Food Security & Agriculture Sectoral Plan, Aug 2026, Table 1): 0.40–0.59 Readiness · 0.60–0.79 Anticipatory Action · 0.80–1.00 Response threshold (urgent field verification). The CDI signals where climate drivers are converging strongly enough to warrant action -- it does not by itself confirm crop failure or food insecurity; field verification and livelihood/market evidence determine the scale and type of response.
Example: PNG (interactive — click a province)
Loading latest CDI period…
Recent CDI components (interactive)
Historical CDI time series (1996-present, interactive)
The historical CDI record for any province can be used to inform and calibrate anticipatory-action thresholds. Dashed line marks CDI 0.6, the Anticipatory Action threshold (see phase bands above).
Executive interpretation
The national overview, graphs, tables, map and operational interpretation are designed to reflect the latest available ASIS/GIEWS screening period where that update is available, while the overview also reports the current PNG live processing workspace date and drought/frost analysis windows. For the CDI phase itself, see About ADAPt.
Province screening details
Overview focus
This dashboard provides a province-level screening view of vegetation condition, drought monitoring and field verification priorities.
It combines live ASIS/GIEWS screening information with the separate PNG live processing workspace for drought and frost review.
Population exposure estimates should be interpreted alongside dedicated overlay analysis, field observations and sector-specific assessment.
Drought and frost processing status
Source: This summary provides the latest drought and frost screening windows from the live processing workspace and complements the full interactive workspace. It is intended to give users a quick public-facing overview.
The latest drought and frost screening overview will appear here when available.
ENSO / IOD outlook
About this card: El Nino-Southern Oscillation (ENSO, measured by the ONI index) and the Indian Ocean Dipole (IOD, measured by the DMI index) are national-scale climate indices, not province-level measurements. They provide background context for the composite biophysical stress score and are not blended into it pixel-by-pixel.
Climate driver context will appear here when available.
Highest vegetation stress provinces
Stress class distribution
Interactive risk map
Download the underlying data
The map above is a live Earth Engine tile layer, not a downloadable file by itself. These are exported alongside it on the same daily schedule:
The GeoTIFF is single-band (composite score 0-100, EPSG:4326, ~5km/pixel -- a national-overview resolution, not survey-grade) and updates on the same daily schedule as the map and the other data files above.
Live ASIS/GIEWS drought and vegetation stress
Source and method: This section summarises the latest available FAO vegetation-health screening update for Papua New Guinea. Non-analytical classes are excluded before province summaries are calculated. This same ASIS vegetation signal is also one of six inputs into the CDI (10% weight, see About ADAPt) -- but updates roughly every 10 days versus CDI's monthly cycle, so treat it as a faster early-warning layer between CDI updates, not a substitute for the CDI phase itself.
Province ranking by vegetation condition
Vegetation condition guide
< 0.35: high vegetation stress.
0.35-0.50: moderate vegetation stress.
0.50-0.65: watch / below-normal vegetation condition.
> 0.65: lower current vegetation stress.
These values help compare current vegetation condition between provinces and identify where field verification should be prioritised.
Live ASIS provincial table
| Rank | Province | Vegetation index | Stress class | Recommended verification priority | Plain-language meaning |
|---|
Composite stress, priority & exposure
About this table: This table combines the vegetation, rainfall, soil-moisture and frost signals into a single composite stress score, an agricultural and exposure priority score, a priority class, and population exposure -- all summarised by province. These are screening and prioritisation metrics, not final impact declarations. This is a different framework from the CDI phase (Readiness/Anticipatory Action/Response threshold) shown on the About ADAPt tab -- the CDI is the primary FSC-endorsed trigger for anticipatory action; the composite score here is a complementary, more frequently-updated screening layer with its own weighting (no ENSO/IOD). The population figures below are also separate from About ADAPt's CDI-linked population figure (different source: WorldPop here vs. PNG NSO 2024 census units there) -- the two should not be added together.
Provincial indicators table
| Province | Composite stress | Class | Ag. priority | Exposure priority | Population exposed | High-exposure pop. | ASIS veg. index | Rainfall % normal | Soil moisture % normal | Frost mean °C |
|---|
CDI-based response guidance
The Combined Drought Index (CDI) phase is ADAPt's primary, government-endorsed trigger for anticipatory action -- see the About ADAPt tab's interactive map or the Interactive Map tab for each province's current phase. This table repeats the same phase-to-action guidance shown there so it sits directly alongside this tab's other response tools.
| CDI phase | Recommended action |
|---|---|
| Readiness CDI 0.40–0.59 | Maintain preparedness while supporting higher-phase operations elsewhere. |
| Anticipatory Action CDI 0.60–0.79 | Activate/scale anticipatory action now; complete field verification and prioritize hotspots. |
| Response threshold CDI 0.80–1.00 | Urgently verify severity and impacts; transition to response only where the CDI signal and field evidence converge. |
The ASIS vegetation-stress framework below is a complementary, higher-frequency layer (ASIS updates roughly every 10 days vs. CDI's monthly cycle) -- useful for catching emerging stress between CDI updates, not a replacement for the CDI phase above.
ASIS vegetation-stress framework (secondary layer)
Field verification approach: Verification should be coordinated through DAL, NARI, NDC, provincial disaster offices, district agriculture officers and relevant partner teams. Verification can use geotagged photos, GPS points, crop condition forms, water-source checks, community/key informant interviews and approved data-collection platforms such as KoboToolbox, ODK, Survey123 or other government/partner systems.
| ASIS stress group | Interpretation | Recommended action |
|---|---|---|
| High | Current vegetation condition indicates strong stress relative to normal and should be treated as the highest verification priority. | Immediate district/province verification, crop and water checks, food-security screening, rapid advisory messaging and escalation where field evidence confirms impacts. |
| Moderate | Vegetation condition is below normal and should be monitored closely for further deterioration. | Rapid crop and rainfall review, repeat checks, local advisory support and targeted verification if market, water or crop concerns are already emerging. |
| Watch | Conditions are below normal but not yet in the highest concern class. | Routine monitoring, district updates and trigger-based follow-up where reports worsen or additional indicators also show stress. |
| Lower | Lower current vegetation stress in the latest dekad. | Routine monitoring, maintain surveillance and verify localised reports if communities flag issues not visible at province scale. |
Field verification checklist
| Check | What to collect | Who can verify |
|---|---|---|
| Crop condition | Photos, GPS points, crop type, damage level, garden age and whether damage is drought-related or from another cause. | DAL/NARI officers, district agriculture officers, provincial teams and partner field teams. |
| Water availability | Water-source status, distance to water, quality concerns, low-flow or drying sources. | Provincial disaster offices, district teams, WASH partners and community focal points. |
| Food access | Meal changes, wild foods, market prices, shortages and coping mechanisms. | Provincial/district teams, partners and community key informants. |
| Hazard attribution | Separate drought stress from frost, pests, fire, flood or market shocks where possible. | Multi-sector assessment teams and technical specialists. |
Live Processing Workspace
Purpose of this tab: This section links to the separate Streamlit-based processing workspace used for live review, processing and export of climate-risk layers. It is separate from the main public briefing dashboard.
Embedded source: png-climate-workspace-v1.streamlit.app. If the embedded view does not load, use the button above to open the processing app directly.
PNGNWS Outlook
Official national reference: This tab links to public outlook and satellite products published by the PNG National Weather Service. These products complement the dashboard screening outputs and provide an official national forecast context for interpretation and briefing.
Official links open in a new tab. Preview images below are synced automatically into this dashboard on a schedule.
Forecast and imagery previews
Preview note: The previews below are mirrored automatically into this dashboard from public PNGNWS products. They refresh on a schedule so the tab remains stable without manual uploads.
3-Month Rainfall Outlook (PNG domain)
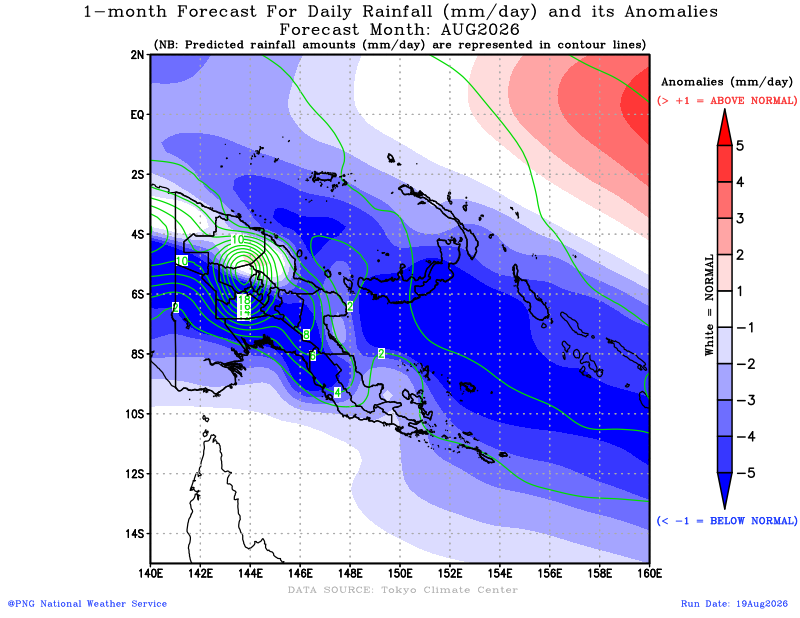
Seasonal rainfall outlook over the PNG domain.
3-Month Rainfall Outlook (Global)
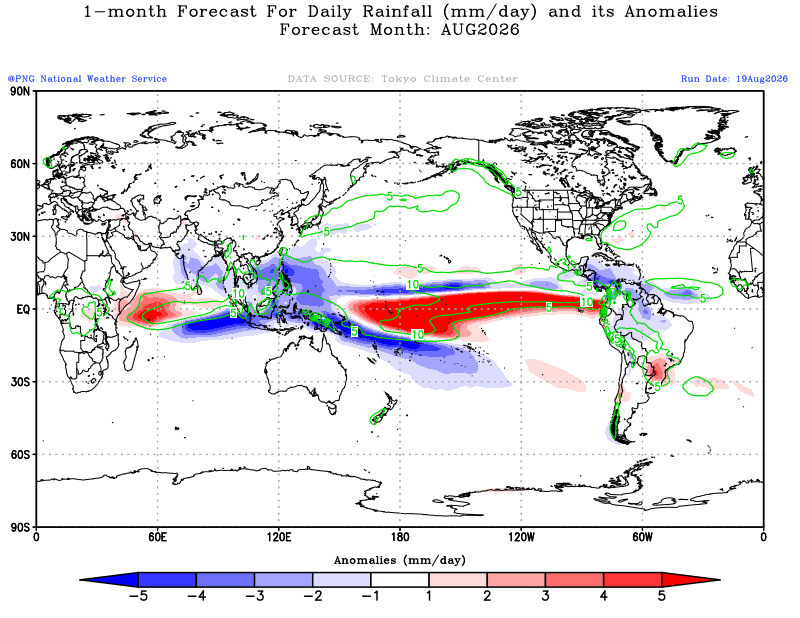
Global seasonal rainfall outlook published by PNGNWS.
31-Day Rainfall Preview (PNG domain)
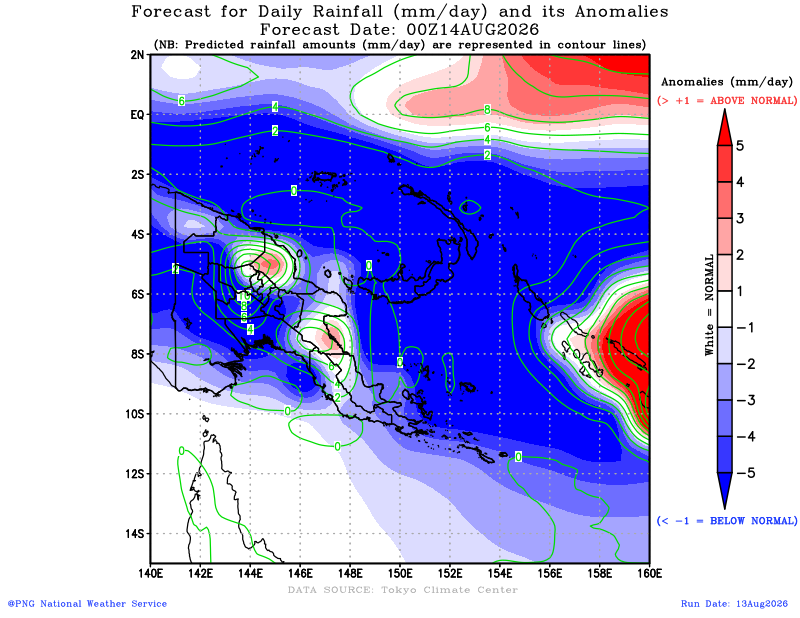
PNG-domain daily rainfall forecast preview from the 31-day outlook.
31-Day Temperature Preview (PNG domain)
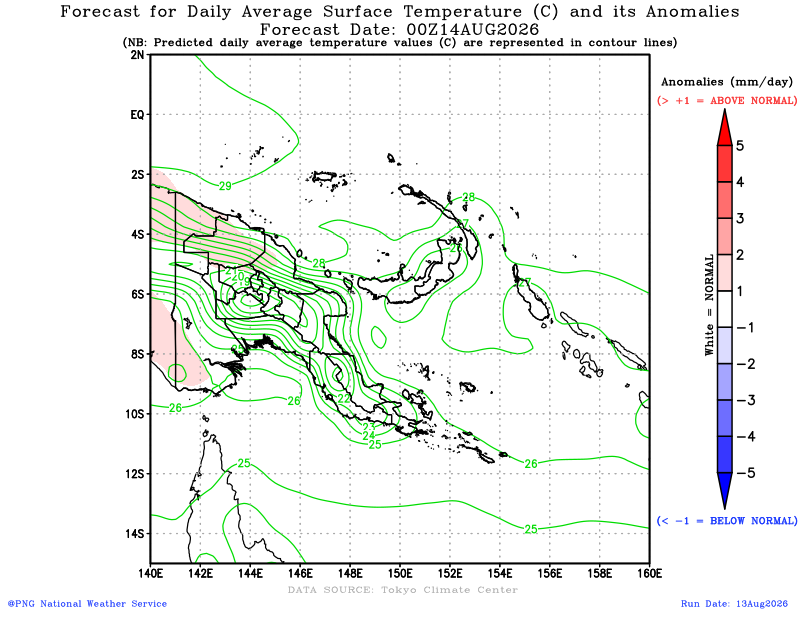
PNG-domain near-surface temperature forecast preview.
Himawari Satellite Preview
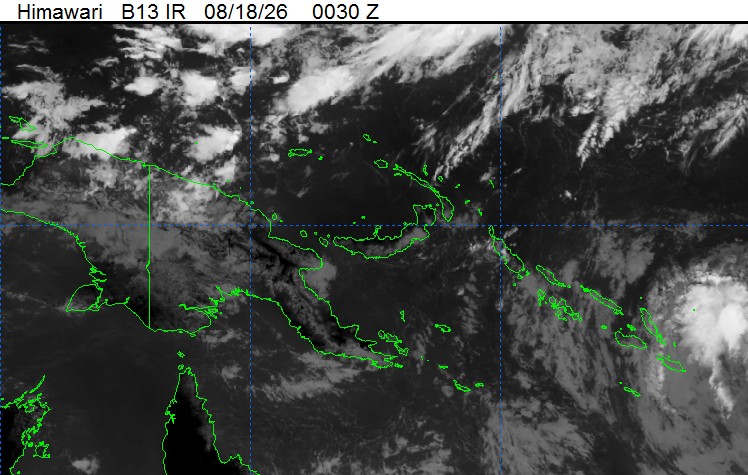
Quick-look infrared satellite frame from the PNGNWS Himawari page.
GSMaP Daily Rainfall Preview
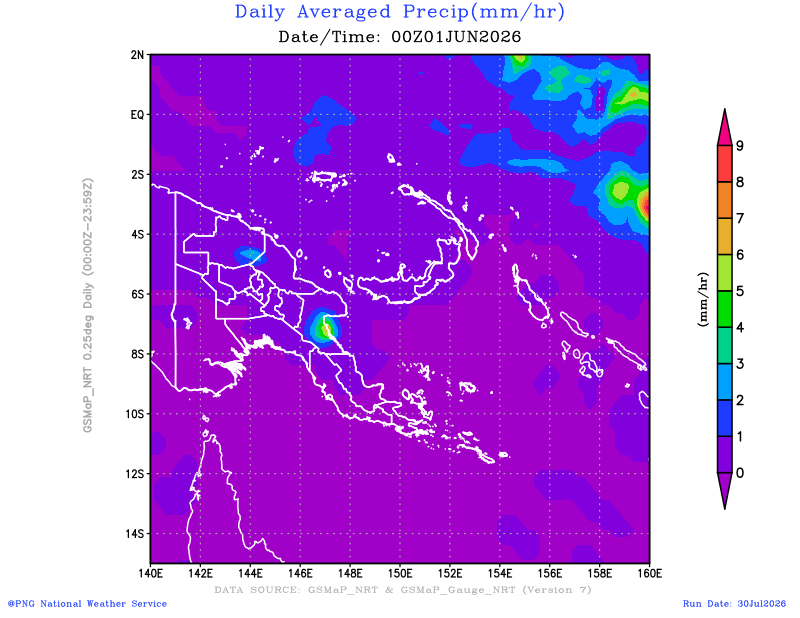
Daily precipitation preview image available from the PNGNWS product stack.
How to use this tab
Use the seasonal and monthly forecast links to compare official national outlook products with the live ASIS/GIEWS vegetation screening, composite stress patterns, and exposure summaries shown elsewhere in the dashboard.
The satellite link can support rapid visual review of current cloud patterns and synoptic conditions, while Public Weather provides day-to-day national reference information.
Suggested interpretation
Use PNGNWS products as the official national forecast context, and use the dashboard as a screening and prioritisation layer for provincial follow-up.
Where both the PNGNWS outlook and the dashboard indicators point in the same direction, confidence in follow-up targeting is stronger. Where they differ, additional technical review and field verification may be needed.
EarthMap
Purpose of this tab: EarthMap is a separate FAO geospatial platform for exploring contextual layers such as rainfall, vegetation condition, land cover, fire, surface water and other indicators relevant to drought and agricultural risk screening.
Embedded source: png.earthmap.org. If the embedded view is restricted by the external site, open EarthMap directly using the button above.
Generate a full ADAPt report
What this does: compiles a detailed report from all of ADAPt’s currently published live data — the Combined Drought Index (CDI) by province, FAO ASIS/GIEWS vegetation screening, composite biophysical stress and population exposure, and ENSO/IOD climate context — into charts, tables and direct links to the underlying data and map layers. It runs entirely in your browser from the same public data files the rest of this dashboard uses, reflects whatever is published at the moment you click Generate, and is not saved or uploaded anywhere.